
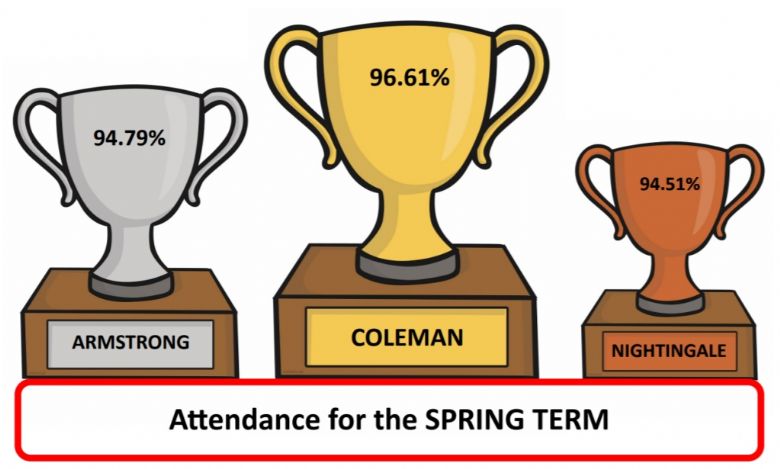
Spring Term 2025
Attendance figures per week - Spring Term 2
This table shows the number of children per class that achieved 100% attendance for the second half of the Spring Term.
|
Einstein Class (Reception) |
Coleman Class (Year 1.2) |
Rashford Class (Year 1.2) |
Attenborough Class (Year 3.4) |
Nightingale Class (Year 3.4) |
Armstrong Class (Year 5) |
Jordan Class (Year 6) |
|
8 |
15 |
13 |
11 |
11 |
11 |
11 |
Attendance figures: Week Beginning 31st March
|
Einstein Class (Reception) |
Coleman Class (Year 1.2) |
Rashford Class (Year 1.2) |
Attenborough Class (Year 3.4) |
Nightingale Class (Year 3.4) |
Armstrong Class (Year 5) |
Jordan Class (Year 6) |
|
90.74% |
95.6% |
91.79% |
89.09% |
95.76% |
94.55% |
86.21% |
Attendance figures: Week Beginning 24th March
|
Einstein Class (Reception) |
Coleman Class (Year 1.2) |
Rashford Class (Year 1.2) |
Attenborough Class (Year 3.4) |
Nightingale Class (Year 3.4) |
Armstrong Class (Year 5) |
Jordan Class (Year 6) |
|
92.96% |
96% |
95.71% |
90.61% |
95.45% |
94.24% |
88.62% |
Attendance figures: Week Beginning 17th March
|
Einstein Class (Reception) |
Coleman Class (Year 1.2) |
Rashford Class (Year 1.2) |
Attenborough Class (Year 3.4) |
Nightingale Class (Year 3.4) |
Armstrong Class (Year 5) |
Jordan Class (Year 6) |
|
97.41% |
100% |
92.14% |
84.55% |
93.64% |
93.64% |
92.07% |
Attendance figures: Week Beginning 10th March
|
Einstein Class (Reception) |
Coleman Class (Year 1.2) |
Rashford Class (Year 1.2) |
Attenborough Class (Year 3.4) |
Nightingale Class (Year 3.4) |
Armstrong Class (Year 5) |
Jordan Class (Year 6) |
|
94.81% |
98.8% |
96.07% |
89.39% |
100% |
93.94% |
91.03% |
Attendance figures: Week Beginning 3rd March
|
Einstein Class (Reception) |
Coleman Class (Year 1.2) |
Rashford Class (Year 1.2) |
Attenborough Class (Year 3.4) |
Nightingale Class (Year 3.4) |
Armstrong Class (Year 5) |
Jordan Class (Year 6) |
|
93.33% |
98.8% |
93.93% |
93.94% |
98.13% |
98.82% |
93.45% |
Attendance figures: Week Beginning 24th February
|
Einstein Class (Reception) |
Coleman Class (Year 1.2) |
Rashford Class (Year 1.2) |
Attenborough Class (Year 3.4) |
Nightingale Class (Year 3.4) |
Armstrong Class (Year 5) |
Jordan Class (Year 6) |
|
95.56% |
98% |
94.84% |
93.33% |
92.5% |
98.18% |
91.72% |
This table shows the number of children per class that achieved 100% attendance for the first half of the Spring Term.
|
Einstein Class (Reception) |
Coleman Class (Year 1.2) |
Rashford Class (Year 1.2) |
Attenborough Class (Year 3.4) |
Nightingale Class (Year 3.4) |
Armstrong Class (Year 5) |
Jordan Class (Year 6) |
|
7 |
15 |
9 |
13 |
10 |
16 |
11 |
Attendance figures per week - Spring Term 1
![]()
Attendance for week beginning 27th January was 94.78%
![]()
Attendance for week beginning 20th January was 93.15%
![]()
Attendance for week beginning 13th January was 94.87%
![]()
Attendance for week beginning 6th January was 88.64%